
Aeris
A personal fitness analytics tool for understanding speed and fitness progress through trends, comparisons, and progress insights.
Built with Next.js, TypeScript, Supabase Postgres, Recharts, PapaParse, Zod, OpenAI Responses API, Vercel
Overview
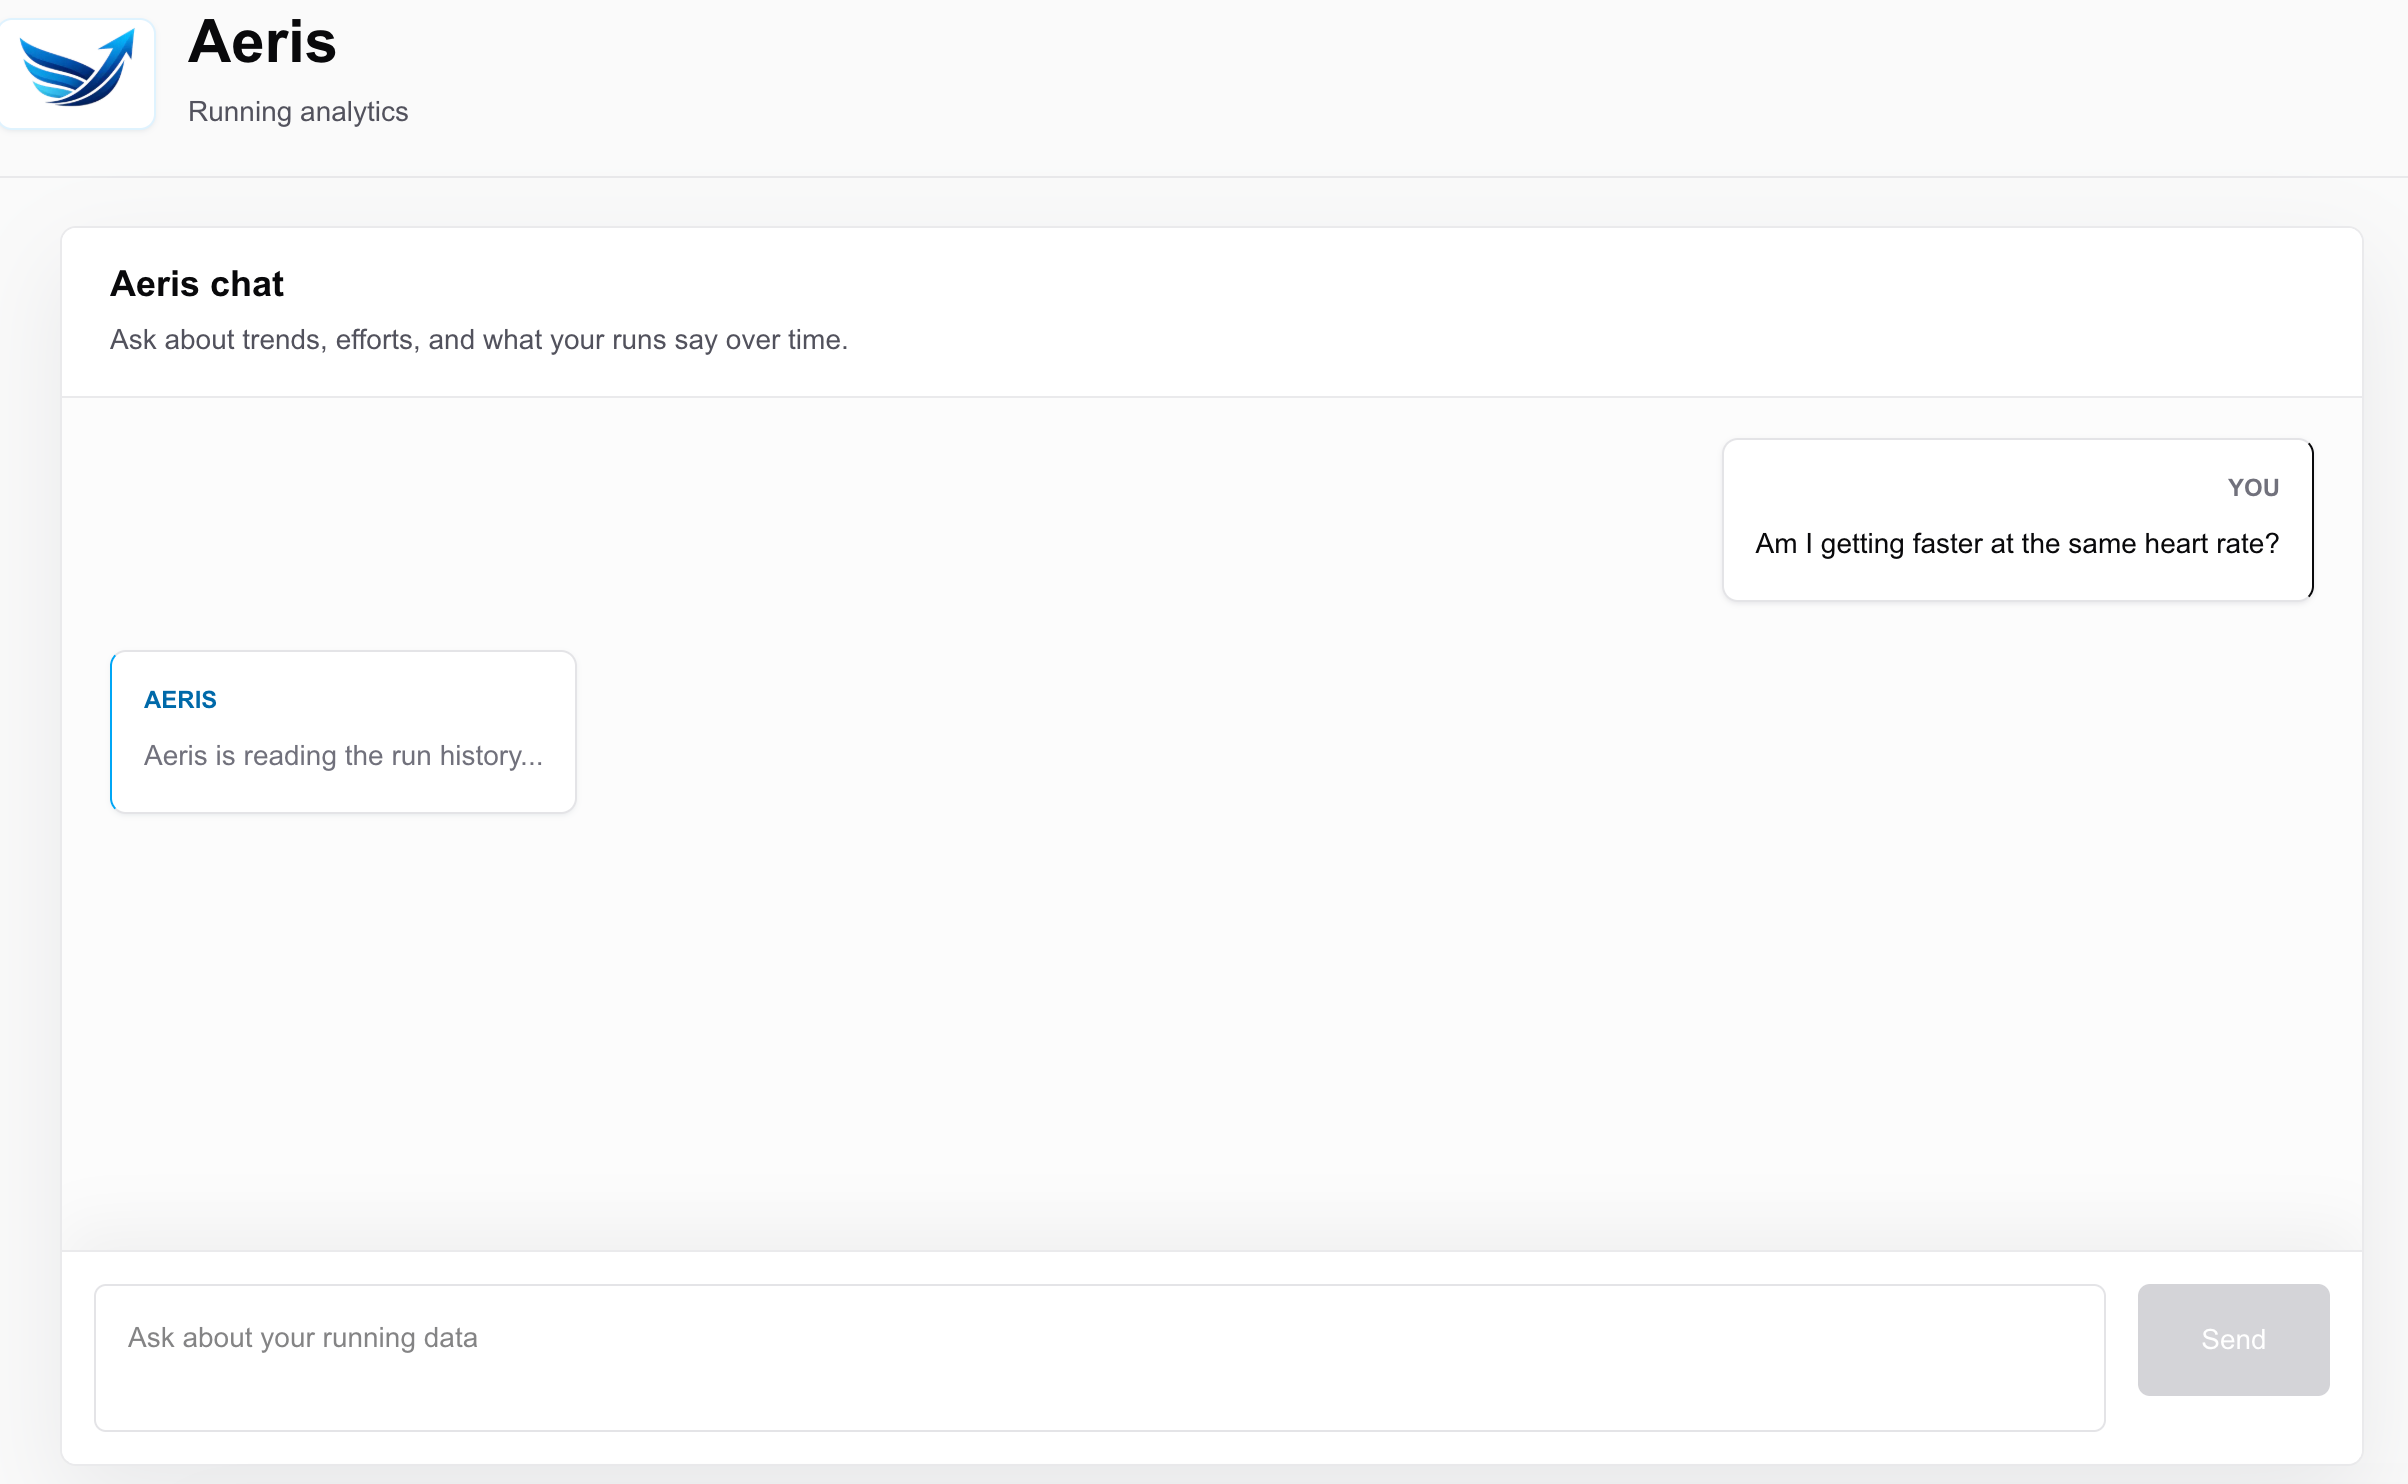
Aeris is a personal fitness analytics tool for understanding speed and fitness progress through trends, comparisons, and progress insights. It started with one practical question: am I getting faster and fitter over time, or am I just looking at disconnected runs one at a time?
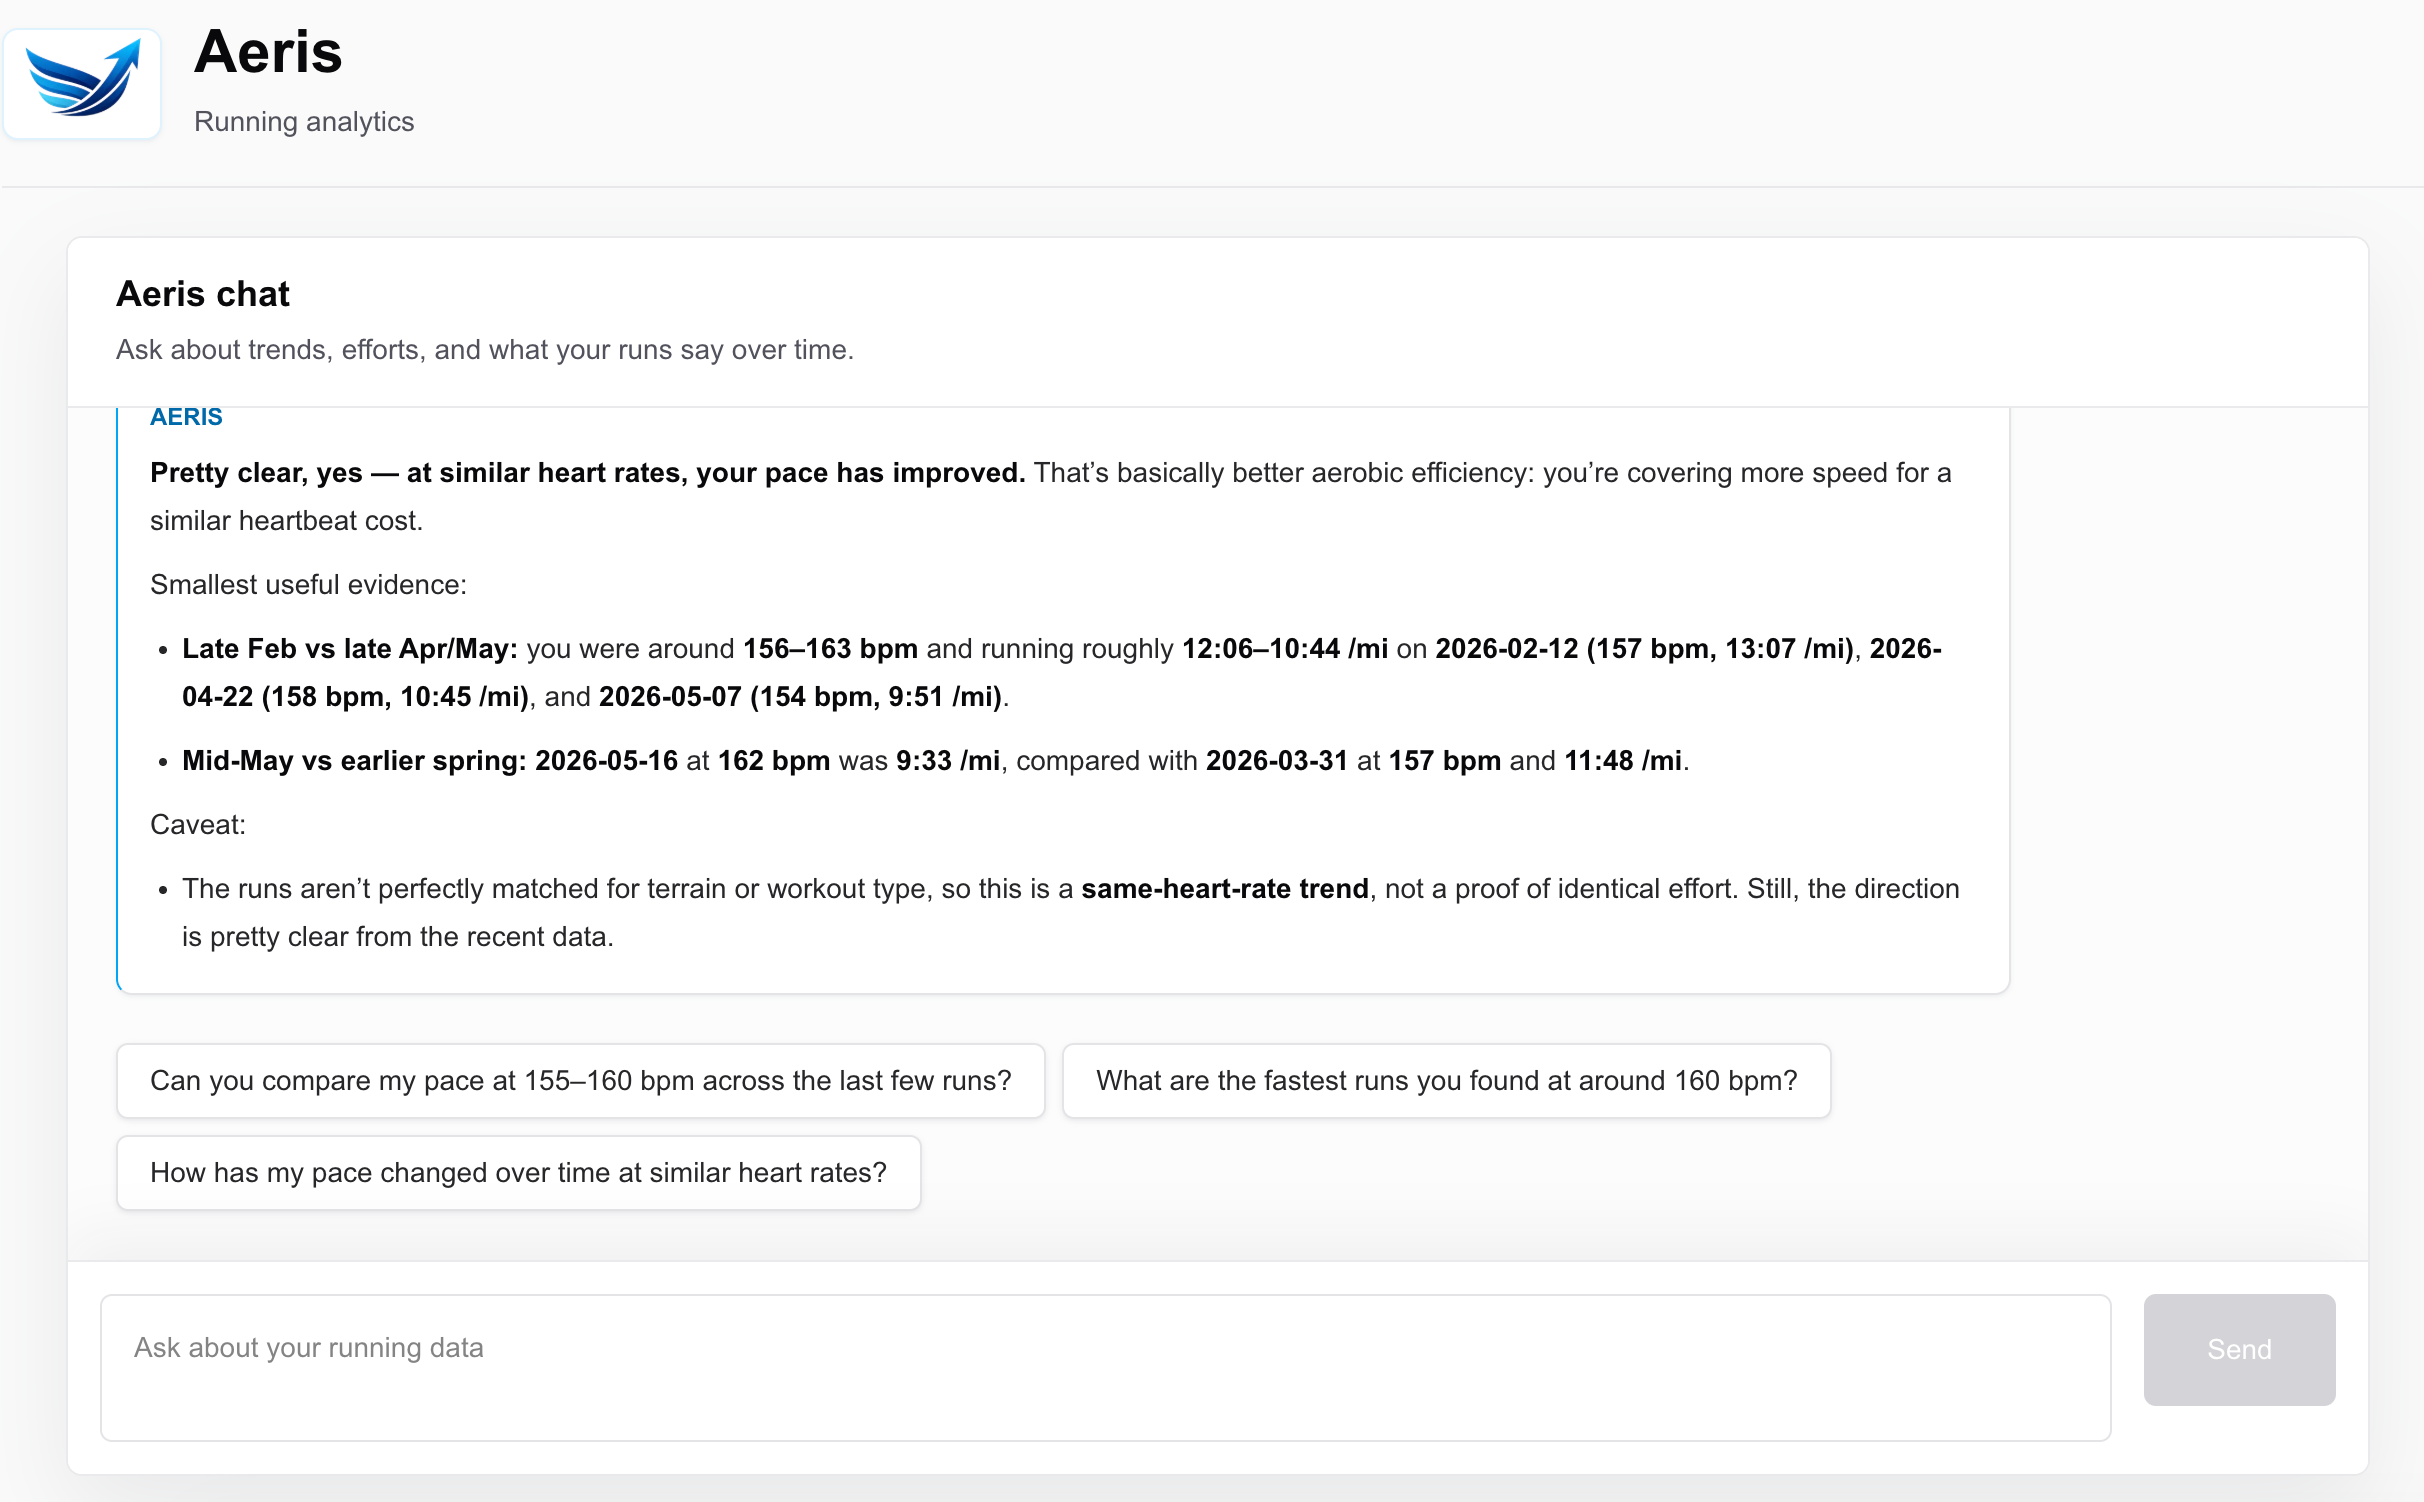
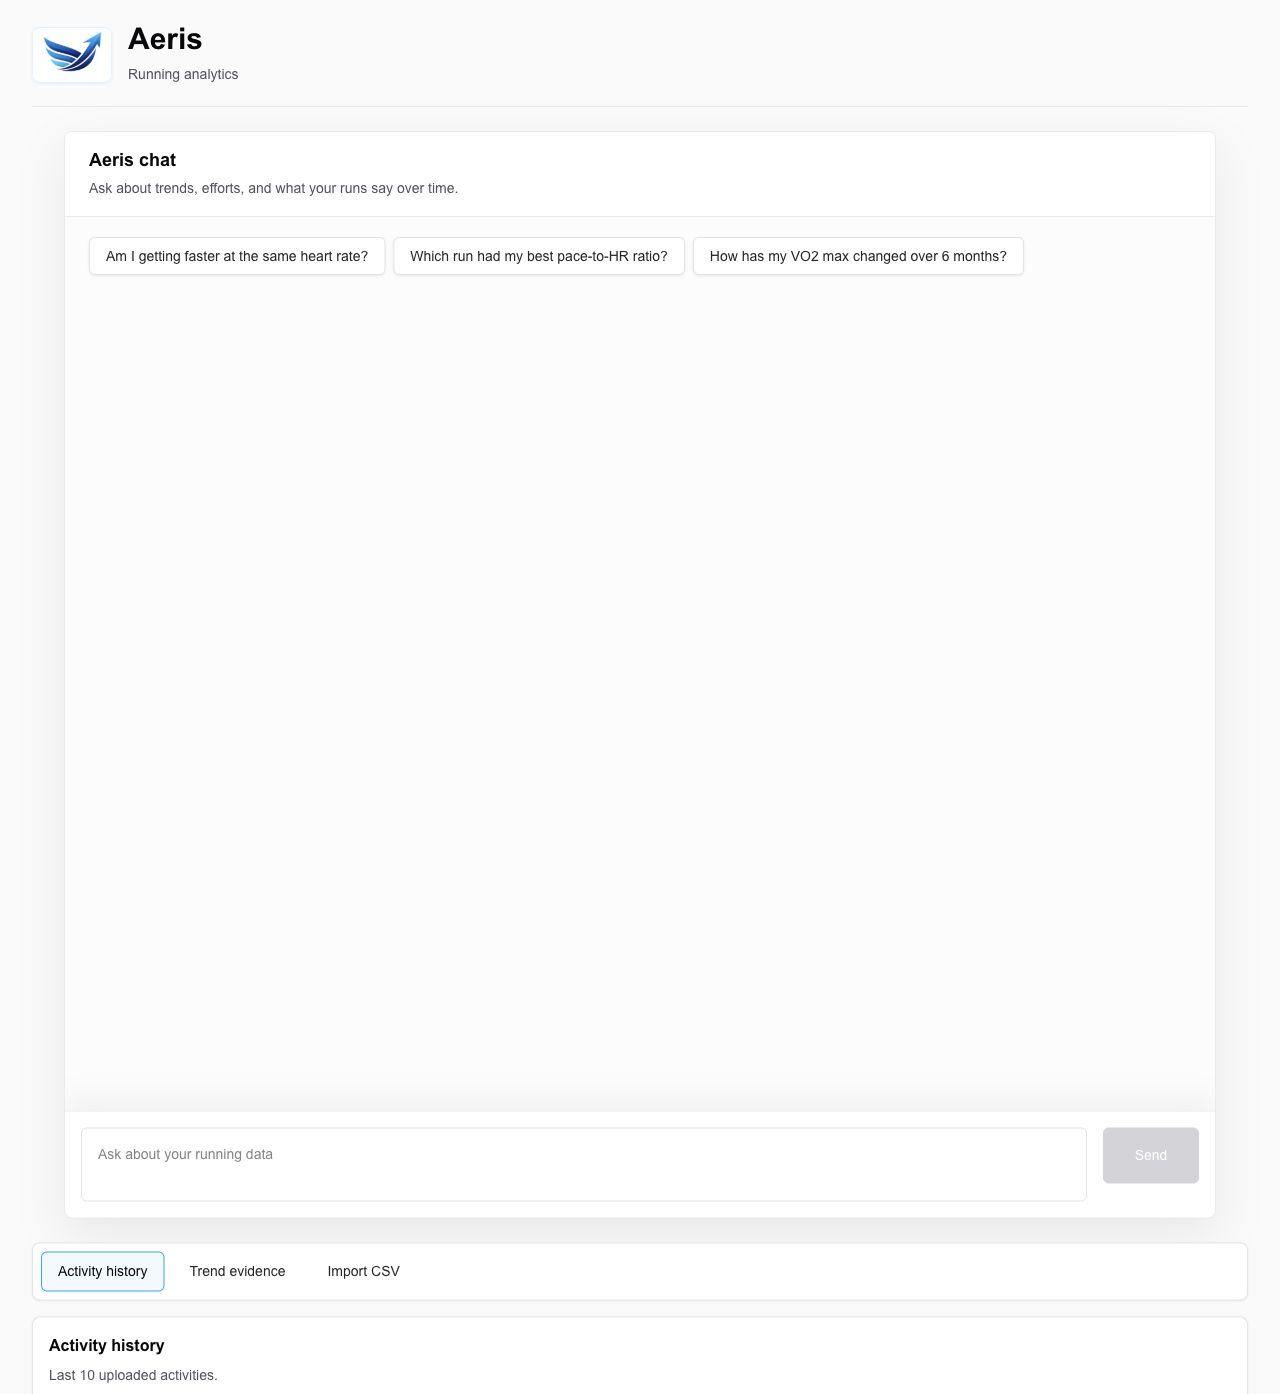
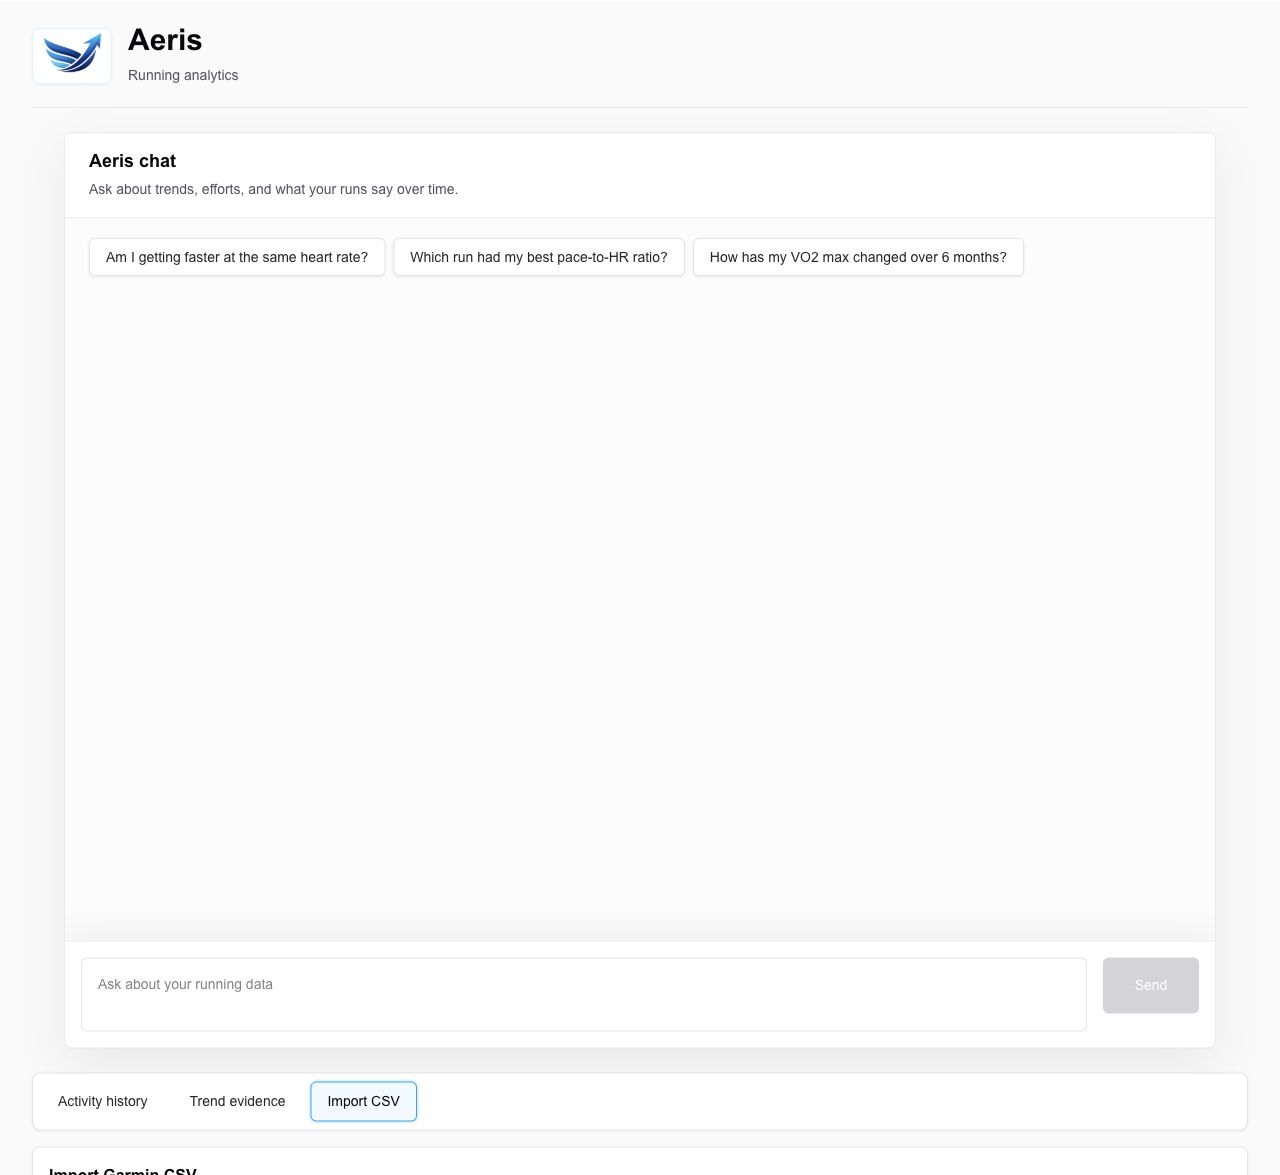
The product turns Garmin CSV activity exports into a small analytics surface: an upload flow, a trend dashboard, and a chat interface that can answer questions using the accumulated running history.
Why I Built It
Garmin Connect stores a lot of useful activity data, but the analysis I wanted required manual comparison. I wanted to ask plain-English questions about pace, heart rate, mileage, VO2 max, and effort-matched progress without opening run after run and building the answer by hand.
Aeris gave me a focused way to explore a product idea around personal data: make the important signals easier to compare, then use chat only where it adds judgment and explanation.
Product Decisions
The MVP stays intentionally narrow. It serves one user, uses manual Garmin CSV import instead of OAuth, and optimizes for the core fitness question before adding coaching, training plans, social features, or multi-user flows.
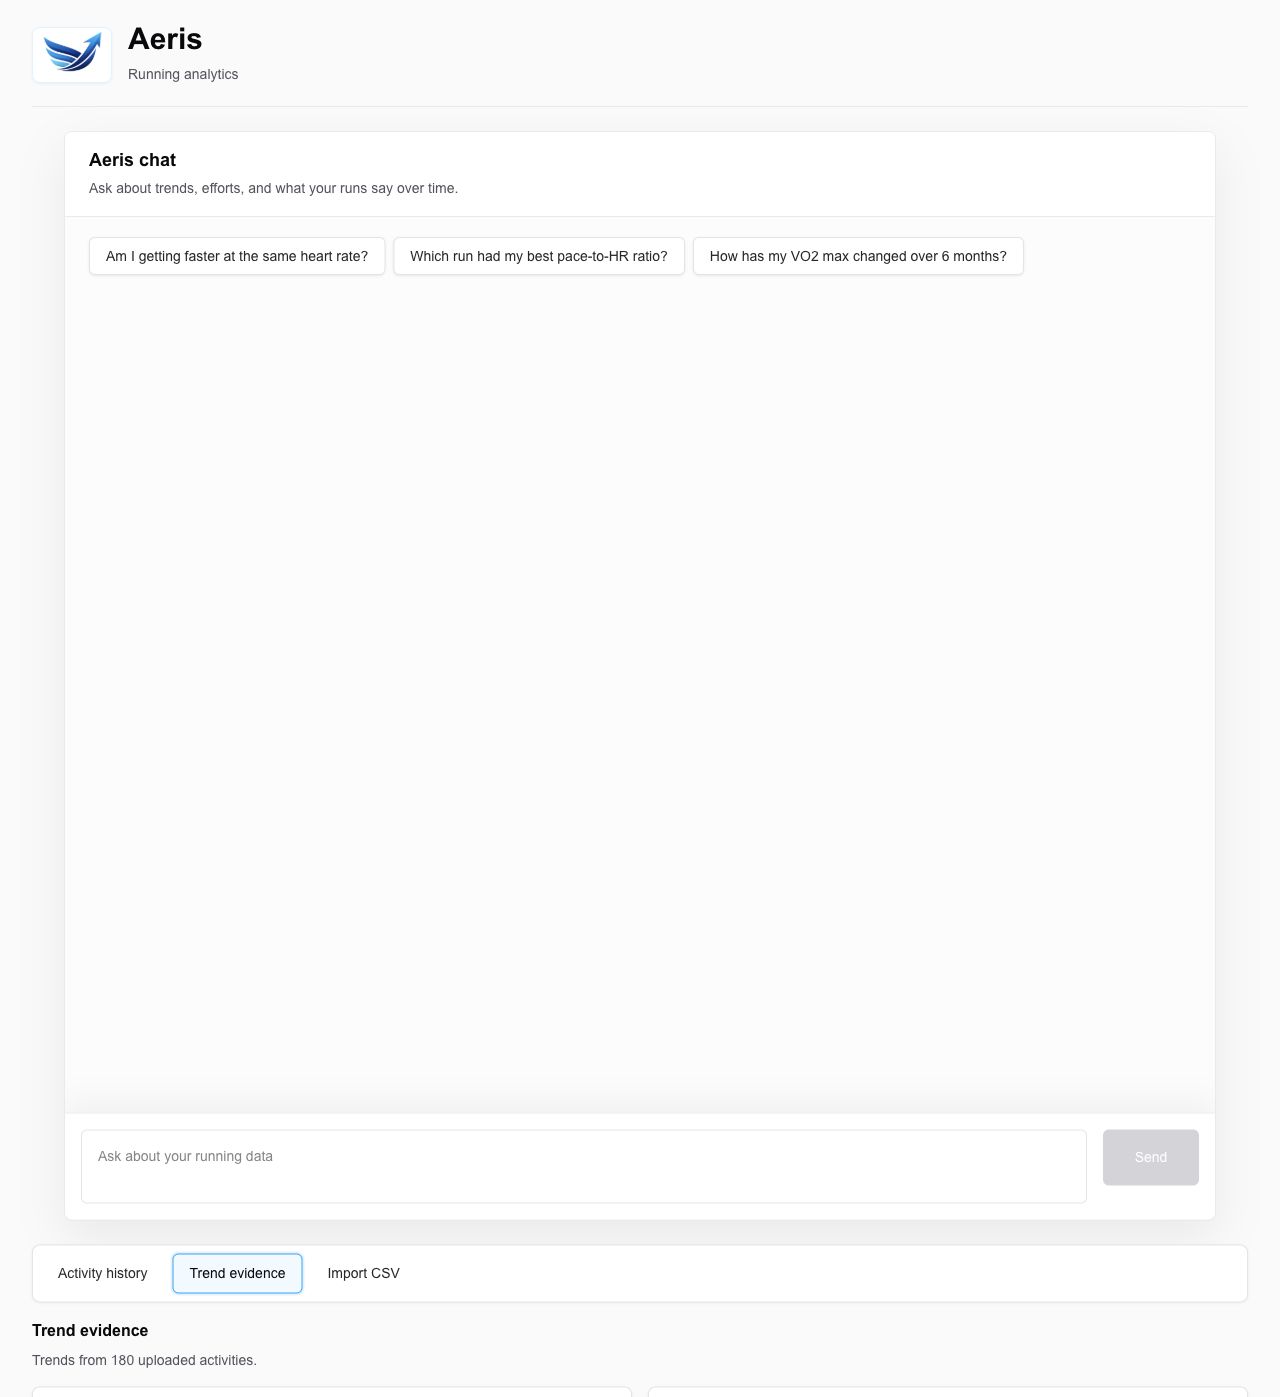
The most important product decision was defining the comparison surface before choosing the technical approach. That product thinking kept Aeris focused on comparing pace at similar heart rates, surfacing weekly mileage and VO2 trends, and explaining uncertainty when the data was noisy or incomplete.
The dashboard handles ambient context: recent runs, weekly volume, pace versus heart rate, aerobic efficiency, and VO2 trends. Chat handles follow-up questions where the answer needs synthesis rather than another chart.
Technical Approach
Aeris is built with Next.js App Router, TypeScript, Supabase Postgres, Recharts, PapaParse, Zod, the OpenAI Responses API, and Vercel. The app parses Garmin CSV files, normalizes activity rows, stores them in Supabase, and prevents duplicate imports using a date, activity type, and distance key.
The dashboard and chat share the same activity model and calculation logic so the product does not tell two different stories about the same run history. Aerobic efficiency is calculated as speed produced per heartbeat, with eligibility rules for distance, duration, and heart-rate ranges.
The chat route sends structured running context to the model instead of using vector search. That kept the MVP simpler and better aligned with the data: most questions are numerical comparisons, date windows, and trend summaries rather than semantic lookup.
What I Learned
The biggest lesson was that the product metric matters more than the model. If aerobic efficiency, date windows, and eligible runs are not defined clearly, the answer can sound confident while still being inconsistent.
I also learned to treat prompt design as product logic. The assistant needs guardrails: answer only from supplied running data, cite periods or run dates when making claims, quantify comparisons where possible, and acknowledge uncertainty when the dataset is thin.
AI-assisted learning helped most when it sharpened unfamiliar implementation details, especially streaming response behavior, context-shaping tradeoffs, and how to keep model output tied to actual calculations instead of vague coaching language.
Screenshots
What I’d Do Next
The next version would make context selection smarter. Most questions do not need every activity row, so query-aware context, weekly and monthly aggregates, and prompt caching would reduce latency and cost while improving answer focus.
After that, I would explore Garmin sync, persistent chat history, and richer trend explanations. I would still keep the product centered on understanding progress, not generating training plans.